
五、部署nrpe
(一)安装nrpe
tar zxvf nrpe-2.8.1.tar.gz
cd nrpe-2.8.1
./configure -prefix=/usr/local/nrpe
make
make install
注:如果在其他被监控机安装nrpe,需要添加系统用户nagios.
(二)复制文件
安装完nrpe后,在安装目录/usr/local/nrpe/libexec只有一个文件check_nrpe,而在nagios插件目录,却缺少这个文件,因此需要把这个文件复制到nagios插件目录;同样,因为nrpe需要调用的诸如check_disk等插件在自己的目录没有,可是这些文件确是nagios插件所存在的,所以也需要从nagios目录复制一份过来。我们把复制过程列举出来:
cp /usr/local/nrpe/libexec/check_nrpe /usr/local/nagios/libexec
cp /usr/local/nagios/libexec/check_disk /usr/local/nrpe/libexec
cp /usr/local/nagios/libexec/check_load /usr/local/nrpe/libexec
cp /usr/local/nagios/libexec/check_ping /usr/local/nrpe/libexec
cp /usr/local/nagios/libexec/check_procs /usr/local/nrpe/libexec
(三)配置nrpe
安装完nrpe以后,在安装目录并没有可用的配置文件,但我们只需把解压目录的样例文件复制到安装目录,然后修改这个文件.
1、 mkdir /usr/local/nrpe/etc
2、 cp sample-config/nrpe.cfg /usr/local/nrpe/etc
3、 修改配置文件/usr/local/nrpe/etc/nrpe.cfg.该过的地方用粗体显示:
pid_file=/var/run/nrpe.pid
server_port=5666
#以单独的守护进程运行
server_address=59.26.240.63
nrpe_user=nagios
nrpe_group=nagios
allowed_hosts=127.0.0.1,59.26.240.63
dont_blame_nrpe=0
debug=0
command_timeout=60
connection_timeout=300
# The following examples use hardcoded command arguments…
command[check_users]=/usr/local/nrpe/libexec/check_users -w 5 -c 10
command[check_load]=/usr/local/nrpe/libexec/check_load -w 15,10,5 -c 30,25,20
#command[check_hda1]=/usr/local/nrpe/libexec/check_disk -w 20 -c 10 -p /dev/hda1
command[check_df]=/usr/local/nrpe/libexec/check_disk -w 20 -c 10
command[check_zombie_procs]=/usr/local/nrpe/libexec/check_procs -w 5 -c 10 -s Z
command[check_total_procs]=/usr/local/nrpe/libexec/check_procs -w 150 -c 200
command[check_ips]=/usr/local/nrpe/libexec/ip_conn.sh 8000 10000
说明:
● allowed_hosts=127.0.0.1,59.26.240.63 必须允许nagios监控服务器可以访问。
● command[check_df]=/usr/local/nrpe/libexec/check_disk -w 20 -c 10 检查整个服务器的磁盘利用率;如果是freebsd系统,因为其/dev分区为100%,需要排除这个分区,因此其命令行应该为 “command[check_df]=/usr/local/nrpe/libexec/check_disk -x /dev -w 20 -c 10″。
● command[check_ips]=/usr/local/nrpe/libexec/ip_conn.sh 8000 10000 ip连接数,ip_conn.sh脚本需要自己写,下面给出脚本的内容:
#!/bin/sh
#if [ $# -ne 2 ]
#then
# echo “Usage:$0 -w num1 -c num2”
#exit 3
#fi
ip_conns=`netstat -an | grep tcp | grep EST | wc -l`
if [ $ip_conns -lt $1 ]
then
echo “OK -connect counts is $ip_conns”
exit 0
fi
if [ $ip_conns -gt $1 -a $ip_conns -lt $2 ]
then
echo “Warning -connect counts is $ip_conns”
exit 1
fi
if [ $ip_conns -gt $2 ]
then
echo “Critical -connect counts is $ip_conns”
exit 2
fi
我在nrpe配置文件nrpe.cfg把脚本所需的两个参数写上了,因此这个脚本就不需判 断两个参数输入值的情况。只要当前ip连接数大于8000,系统就发warning报警,超过10000,则发”critical”报警信息。把这个脚本放在目录/usr/local/nrpe/libexec下,并给于执行权限。
(四)、启动nrpe服务并检验其配置
1、以独立守护进程启动nrpe服务 /usr/local/nrpe/bin/nrpe -c /usr/local/nrpe/etc/nrpe.cfg -d
2、通过察看系统日志,正常启动可以看到如下输出:
Mar 2 21:07:18 MONITOR nrpe[23823]: Starting up daemon
Mar 2 21:07:18 MONITOR nrpe[23823]: Listening for connections on port 5666
Mar 2 21:07:18 MONITOR nrpe[23823]: Allowing connections from: 127.0.0.1,59.26.240.63
察看端口,也能看见5666端口处于监听状态:
[root@MONITOR nrpe]# netstat -an
Active Internet connections (servers and established)
Proto Recv-Q Send-Q Local Address Foreign Address State
tcp 0 0 59.26.240.63:5666 0.0.0.0:* LISTEN
察看进程:
[root@MONITOR nrpe]#ps aux | grep nrpe | grep -v grep
nagios 23823 0.0 0.0 4864 924 ? Ss 21:07 0:00 bin/nrpe -c etc/nrpe.cfg -d
3、检查插件功能
(1)检查nrpe服务
[root@MONITOR nrpe]# libexec/check_nrpe -H 59.26.240.63
NRPE v2.8.1
(2)通过nrpe检查主机资源
[root@MONITOR nrpe]# libexec/check_nrpe -H 59.26.240.63 -c check_df
DISK OK – free space: / 8241 MB (77% inode=98%); /var 5239 MB (95% inode=99%); /usr 11971 MB (86% inode=97%); /dev/shm 1013 MB (100% inode=99%);| /=2417MB;11218;11228;0;11238 /var=273MB;5792;5802;0;5812 /usr=1807MB;14508;14518;0;14528 /dev/shm=0MB;993;1003;0;1013
[root@MONITOR nrpe]#libexec/check_nrpe -H 59.26.240.63 -c check_ips
OK -connect counts is 13956
六、启动nagios:验证nagios工作状态
1、检查配置: nagios的验证非常准确,凡是不能正确启动nagios,皆可以从错误输出找到答案.
/usr/local/nagios/bin/nagios -v /usr/local/nagios/etc/nagios.cfg
Reading configuration data…
Running pre-flight check on configuration data…
……………
Total Warnings: 0
Total Errors: 0
Things look okay – No serious problems were detected during the pre-flight check
2、启动nagios
/usr/local/nagios/bin/nagios -d /usr/local/nagios/etc/nagios.cfg
3、检验监控效果。现在我们监控了本机的web服务,但由于apache服务还没有被启动起来,所以等待片刻后,正常情况下会收到邮件和手机短信报警信息;等后面我们把apache服务起来后,应该能够收到服务已经恢复的报警短信和邮件。
4、创建web验证用户。我们根据前面apache配置文件的验证方法来创建用户:
/usr/local/apache/bin/htpasswd -c /usr/local/nagios/etc/htpasswd sery
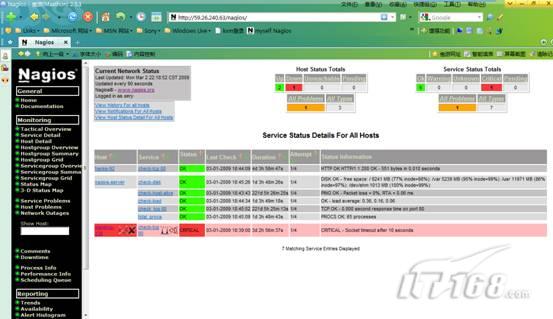
5、启动apache服务,然后在别的机器的浏览器地址栏输入 http://59.26.240.63/nagios,再输入第”4″产生的用户名及设定的密码,即可通过web方式察看监控系统当前的状态(浏览器自动刷新屏幕),如下图所示:
我们一直都在努力坚持原创.......请不要一声不吭,就悄悄拿走。
我原创,你原创,我们的内容世界才会更加精彩!
【所有原创内容版权均属TechTarget,欢迎大家转发分享。但未经授权,严禁任何媒体(平面媒体、网络媒体、自媒体等)以及微信公众号复制、转载、摘编或以其他方式进行使用。】
微信公众号

TechTarget
官方微博

TechTarget中国
作者
相关推荐
-
OpenStack Days首登中国大陆,国内外云计算精英论道北京
上周(7月14-15),久负盛名的OpenStack Days全球巡展中国站于北京顺利召开,超过2000位云计算产业从业者齐聚国家会议中心,共同探讨OpenStack技术的发展趋势与技术特点,分享OpenStack在不同行业的应用实践最佳案例和成果……
-
AT&T透露ECOMP SDN平台细节
AT&T日前在硅谷举行的开放网络峰会上揭开了其ECOMP(Enhanced Control、Orchestration、Management及Policy)架构的神秘面纱,该平台主要用于向企业提供自助网络服务。
-
思科、瞻博网络向OpenDaylight贡献新代码 共同推动SDN发展
OpenDaylight创始者们计划创建SDN控制器和代码以开放接受用户贡献,并作为所有供应商开放SDN战略的平台,这一计划目前正在逐步实现。
-
网络管理系统也要“量体裁衣”
你也许考虑过用一根火柴或一个核反应堆来煮一个鸡蛋。对于这个工作来说,这两种方法都没有做到“量体裁衣”。